

| 1. Download Phyloviz | 2. Loading Data | 3. Running the Data Analysis algorithms | 4. The PHYLOViZ Display Interface | 5. Querying and Visualizing the data |
4. The PHYLOVIZ Display Interface
4.1.) Interface features
After running the selected algorithm, you will notice that the program then tries to optimize the display of the group with the largest number of elements in the data set. You can change the speed at which this occurs by moving the animation speed slider.
The Display tab offers the user the ability to search for an isolate, Highlight the SLVs and DLVs, control the animation speed, select diferent diferent or multiple groups. You can fit any displayed graphs to the window by right-clicking any open space (i.e. with no link or ST node) on the window.
Click on the screenshots to see how to use the features.
Basic interface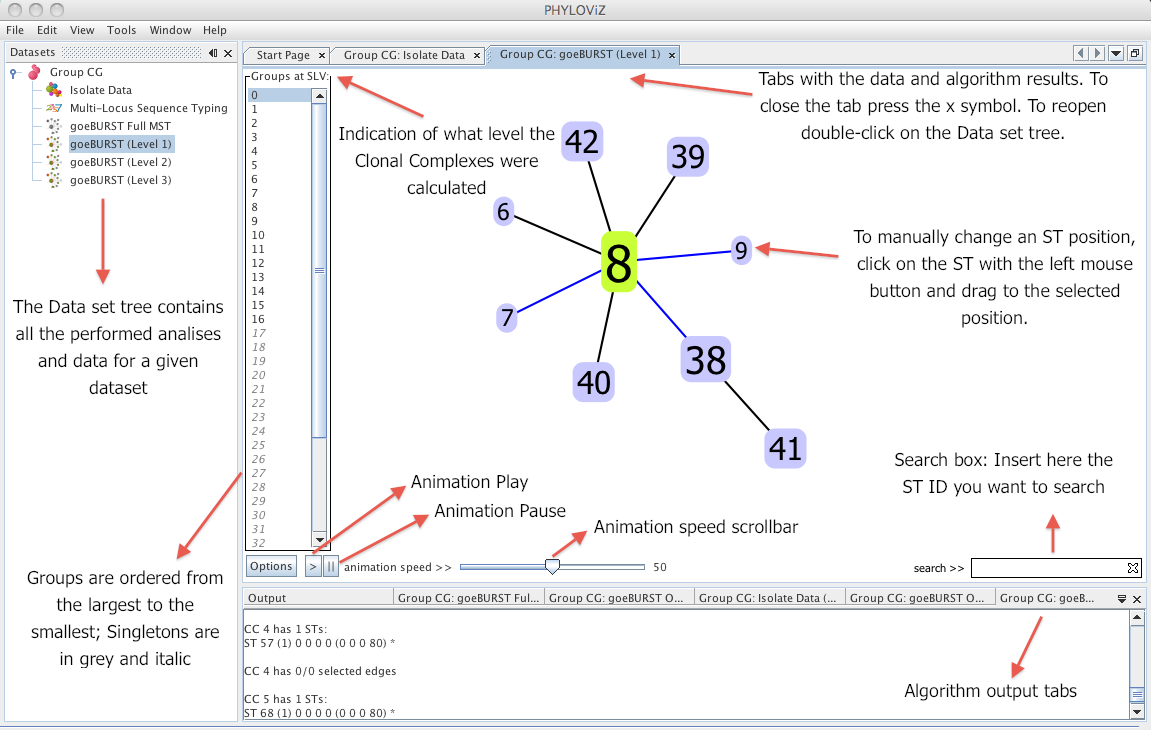 |
SLV/DLV highlighting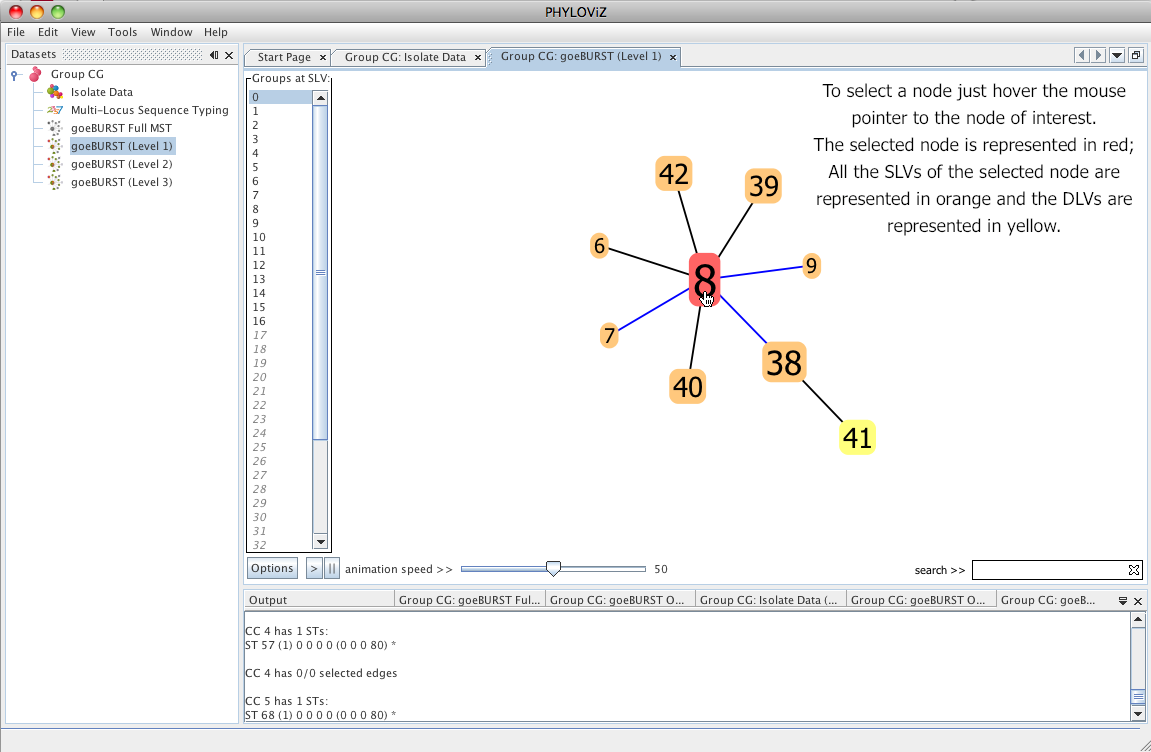 |
ST Search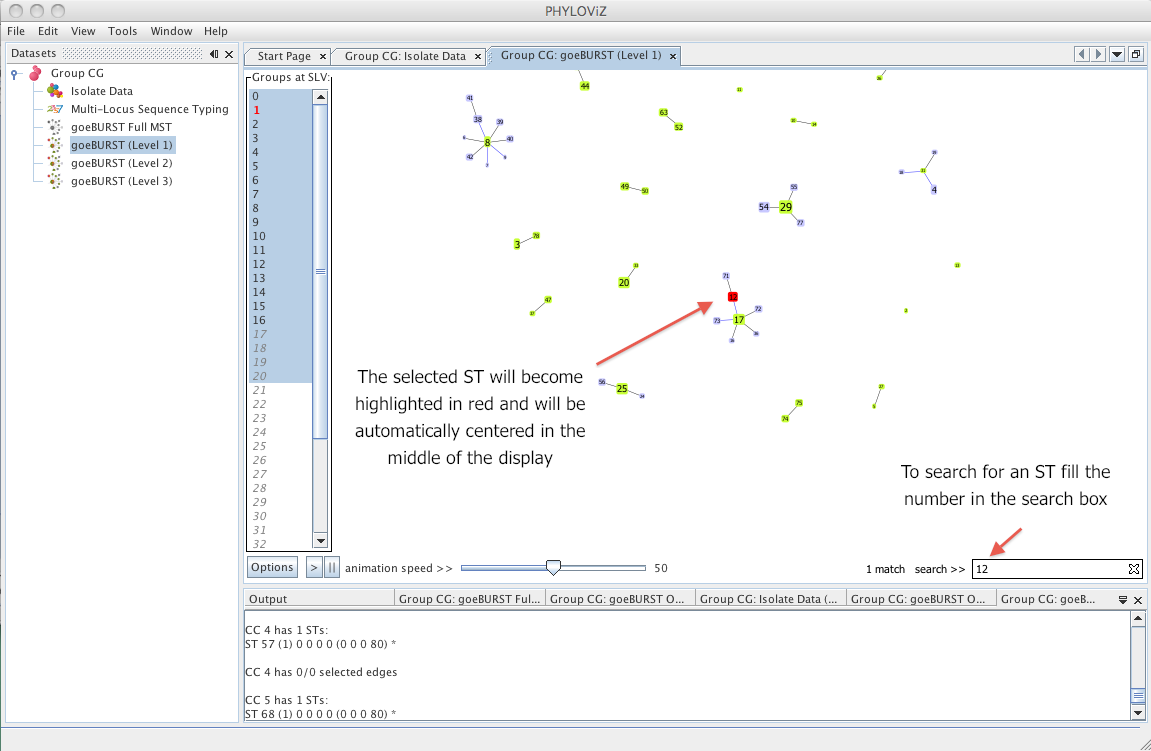 |
Information area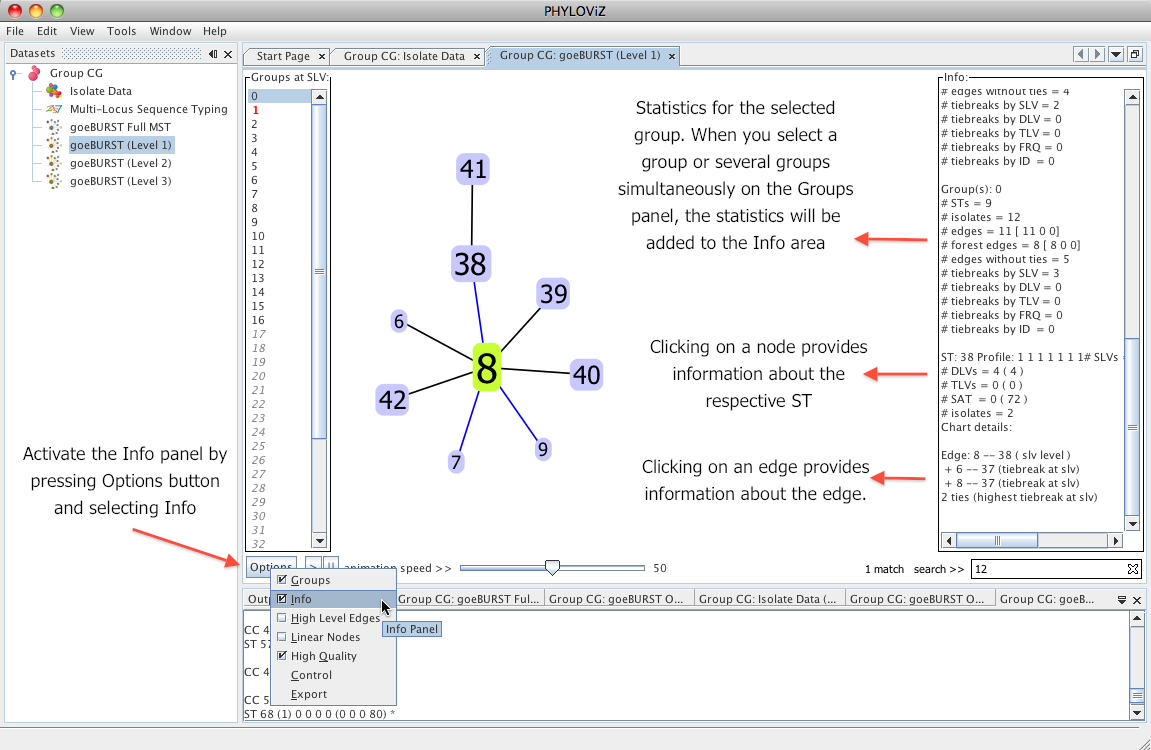 |
Force Control menu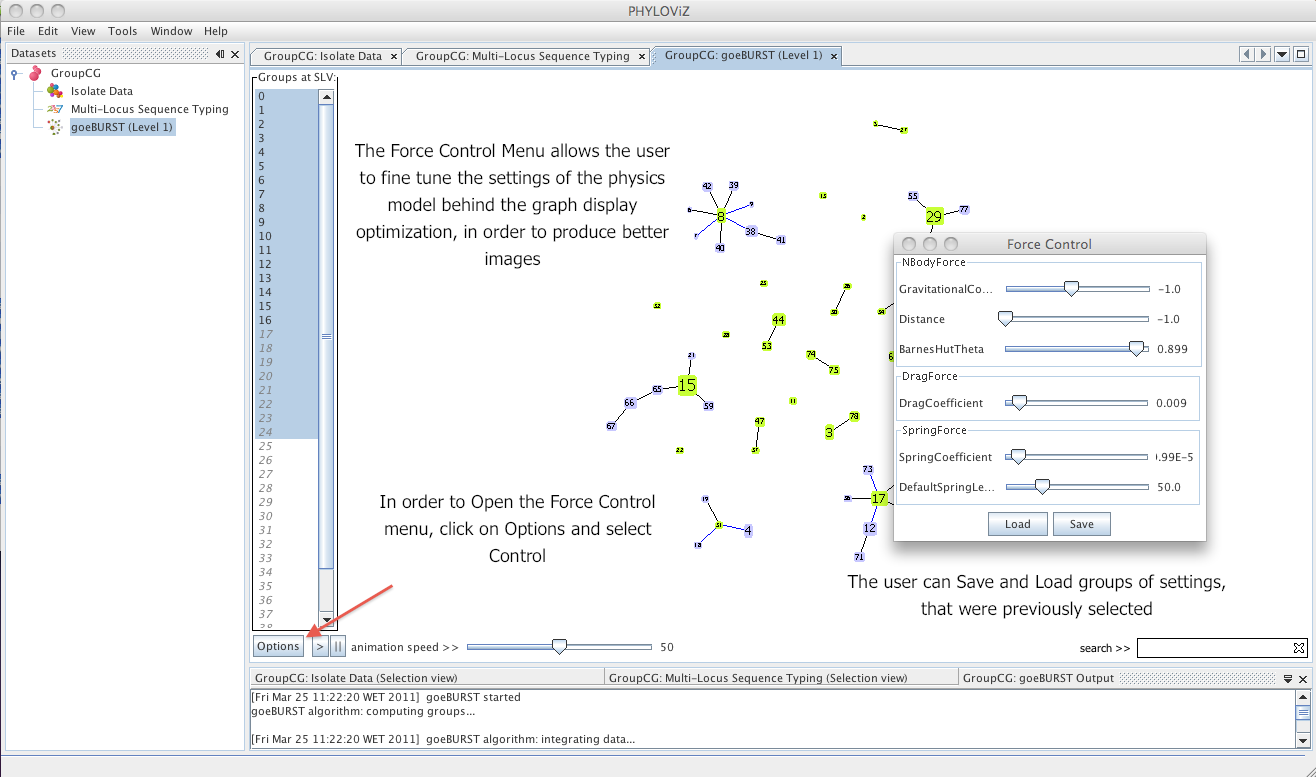 |
High Level Edges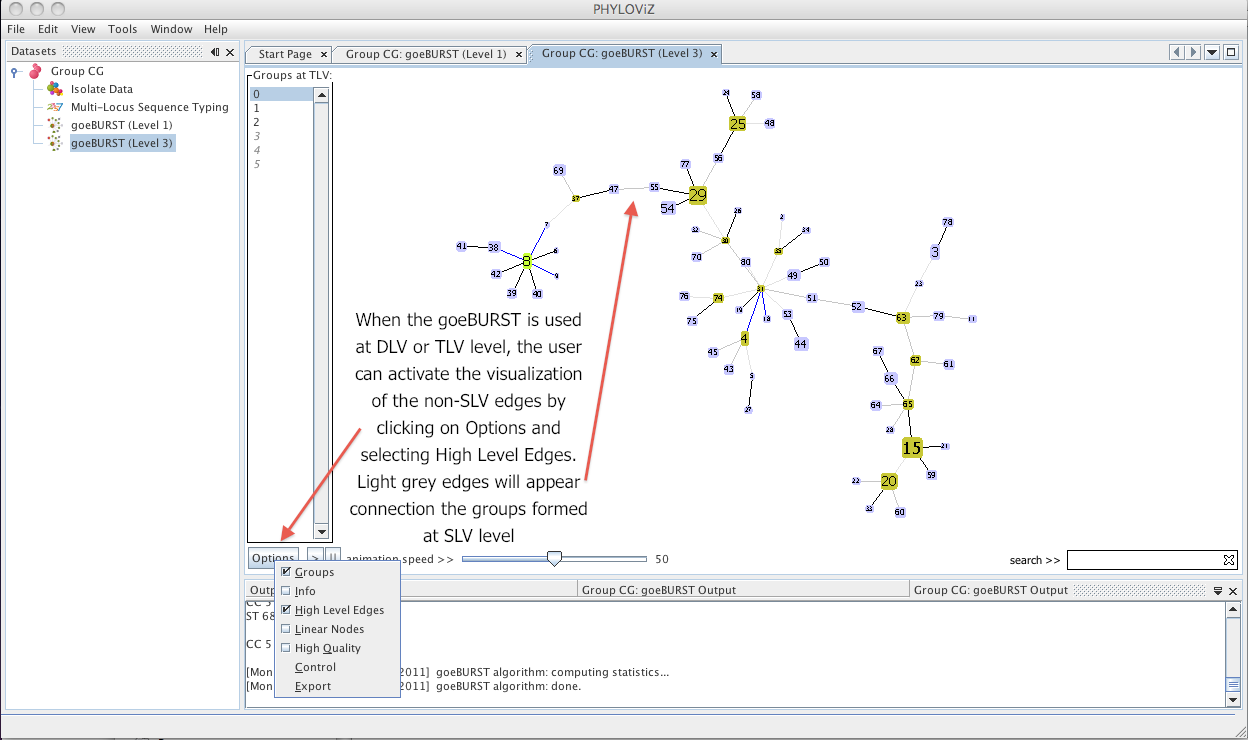 |
Changing group founder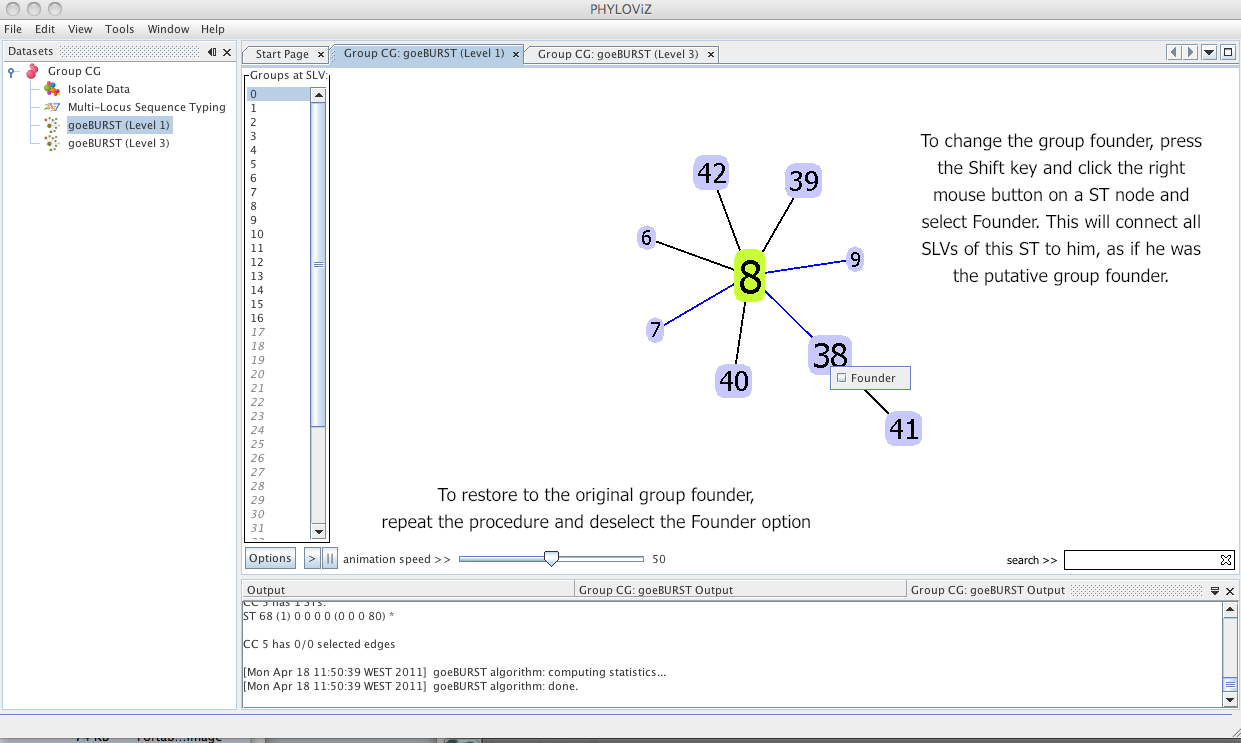 |
Saving results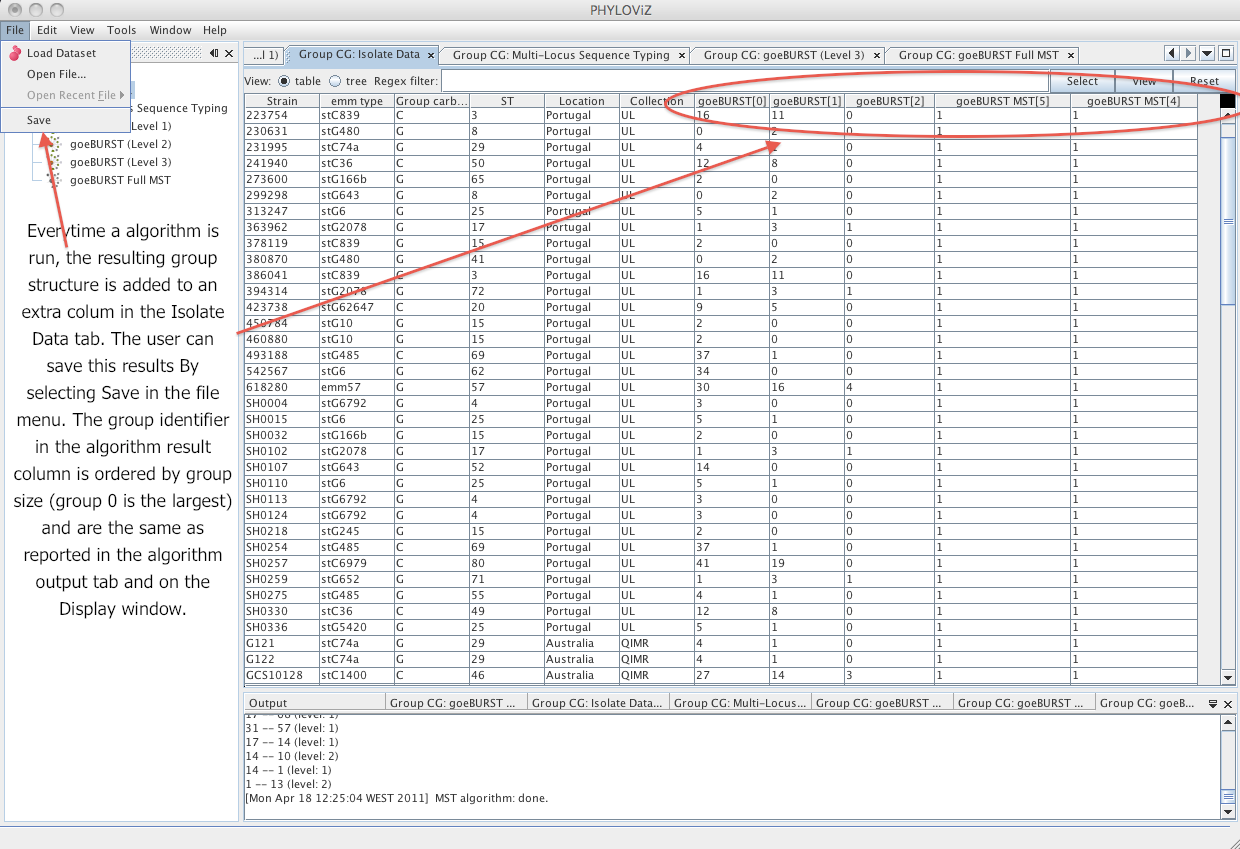 |
4.2) Color Conventions
Link colors for goeBURST results
- Black - Link drawn without recourse to tiebreak rules
- Blue - Link drawn using tiebreak rule 1 (number of SLVs)
- Green - Link drawn using tiebreak rule 2 (number of DLVs)
- Red - Link drawn using tiebreak rule 3 (number of TLVs)
- Yellow - Link drawn using tiebreak rule 4 or 5 (Frequency found on the data set and ST number , respectively)
- Gray - Links drawn at DLV (darker gray) or TLV (lighter gray) if the groups are constructed at DLV/TLV level
The goeBURST Full MST algorithm links uses a grayscale with darker links having less differences between the profiles than the lighter gray links. To know the number of differences that the link represents click on the link in the Display window.
ST nodes colors
- Light green - Group founder
- Dark green - Sub-group founder
- Light blue - Common node
- Red - Selected node
Finally to learn how to query and visualize the data in the Data Analysis results proceed to the Querying and Visualizing the data tutorial
| 1. Download Phyloviz | 2. Loading Data | 3. Running the Data Analysis algorithms | 4. The PHYLOViZ Display Interface | 5. Querying and Visualizing the data |